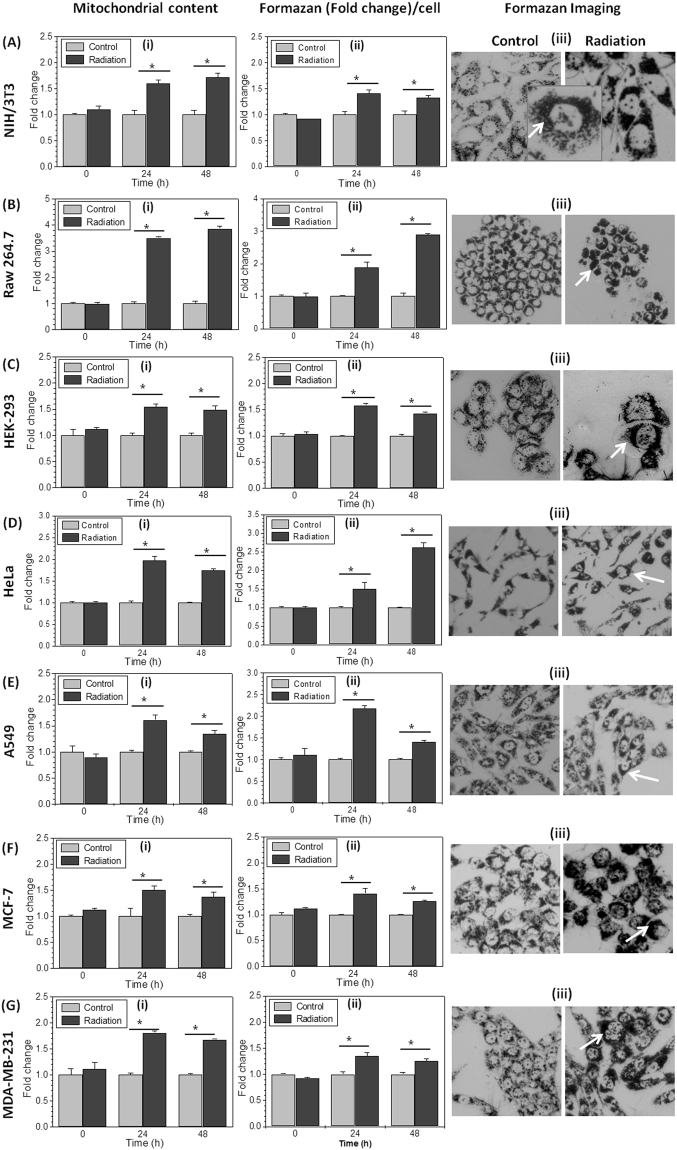
Figure 2.
Radiation increases mitochondrial mass per cell and enhances formazan formation: The mitochondrial mass was analyzed by staining cells with MitoTracker Green FM (100 nM; 20 min) at indicated time points. Graphs Ai- Gi (cell lines as described in Fig. 1) showing mean fluorescence intensity (MFI), presented as fold change with respect to control. (Aii–Gii) The Formazan formed per cell was quantified spectro-photometrically and presented as fold change of control at respective time points in different cell lines. (Aiii–Giii) Photomicrograph showing formazan accumulation (at 20X objective), in control and irradiated cells captured after 2 hrs of MTT incubation at 24 hrs post irradiation in different cell lines. Zoom image of one irradiated cell is highlighted to show the enhanced punctuated formazan deposition. Data are presented as mean ± SD (n = 4) *p < 0.05 vs. untreated control cells.

