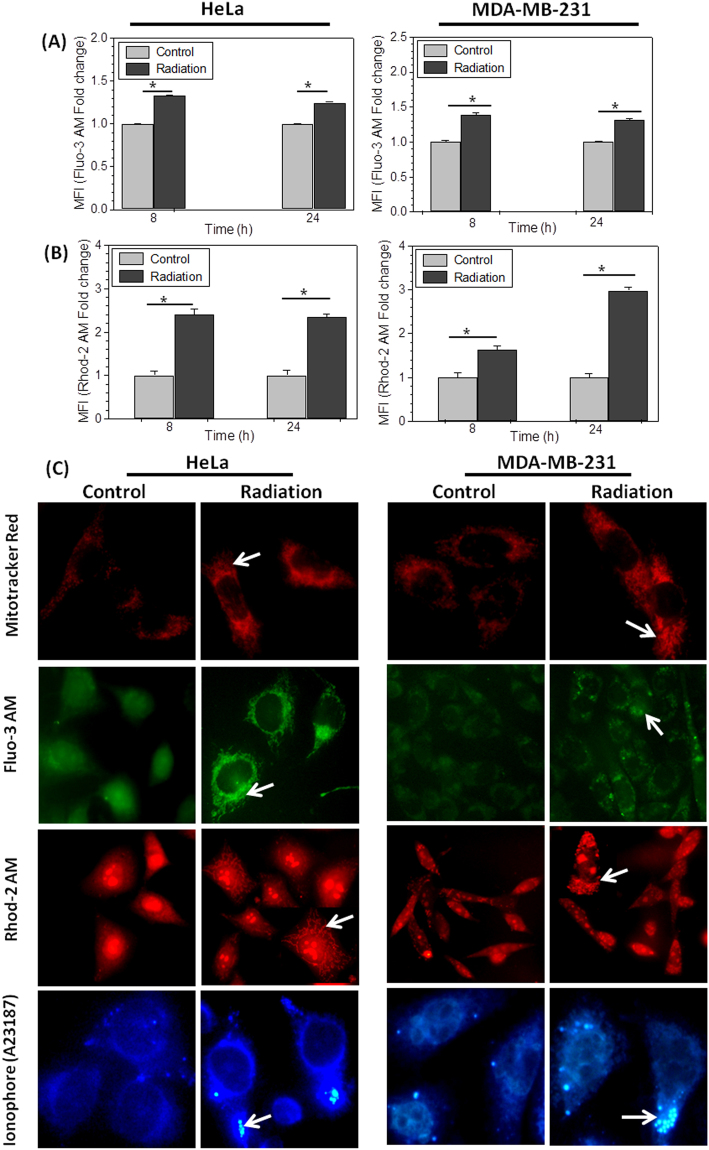
Figure 5.
Radiation induces mitochondrial Ca2+ accumulation: (A and B) Bar diagram shows alteration in Ca2+ concentration in HeLa and MDA-MB-231 cells stained with Fluo-3 AM (5 µM; 30 min) and Rhod-2 AM (1 µM; 20 min; 37 °C), analyzed using flow cytometer. MFI fold change is presented here at 8 and 24 hrs post-irradiation with respect to control. (C) Photomicrograph shows the radiation induced change in mitochondria using MitoTracker® Red and cellular distribution of Ca2+ stained with Fluo-3AM and mitochondrial calcium using Rhod-2 AM, fluorescent probes. Zoomed images of Rhod-2 AM stained single cell is highlighted for better appreciation of radiation induced accumulation of mitochondrial Ca2+. Fourth row shows A23187 (6 µM, 30 mins) stained cells, showing Ca2+ loaded mitochondria in HeLa and MDA-MB-231cells. Images were captured under fluorescence microscope with 40X objective.

