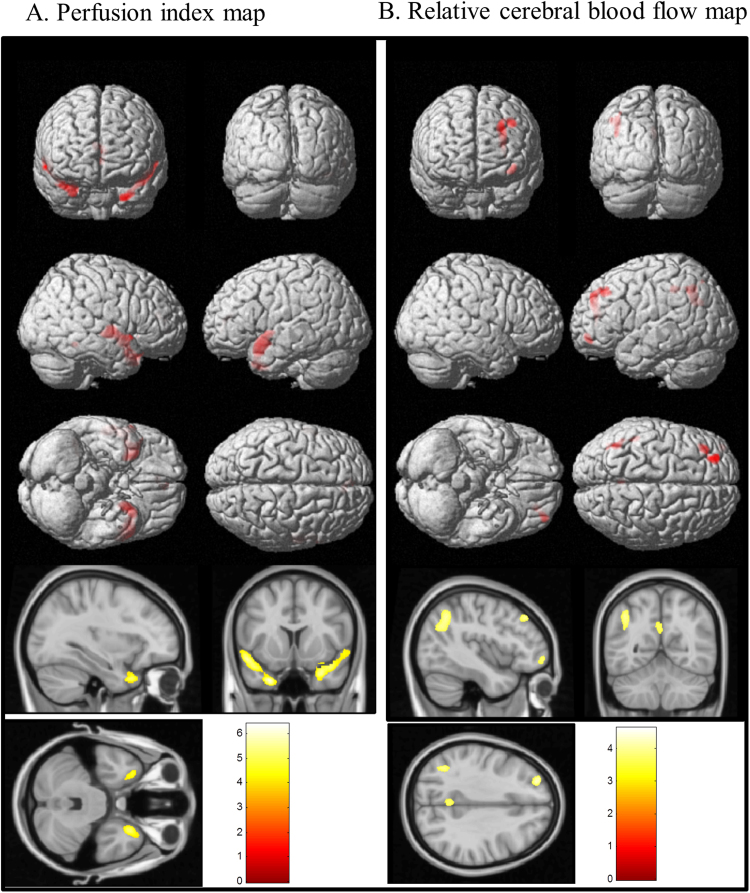
Figure 5.
Correlation between composite language scores and (A) perfusion index map and (B) relative cerebral blood flow. The red color rendered onto the 3-dimensional brain images represents positive correlations with intensity as the depth from the brain surface. Representative slices with a color bar representing the range of t values are shown below. Images were statistically thresholded at p < 0.05, and a false discovery rate correction for multiple comparisons, cluster > 200.

