Figure 3.
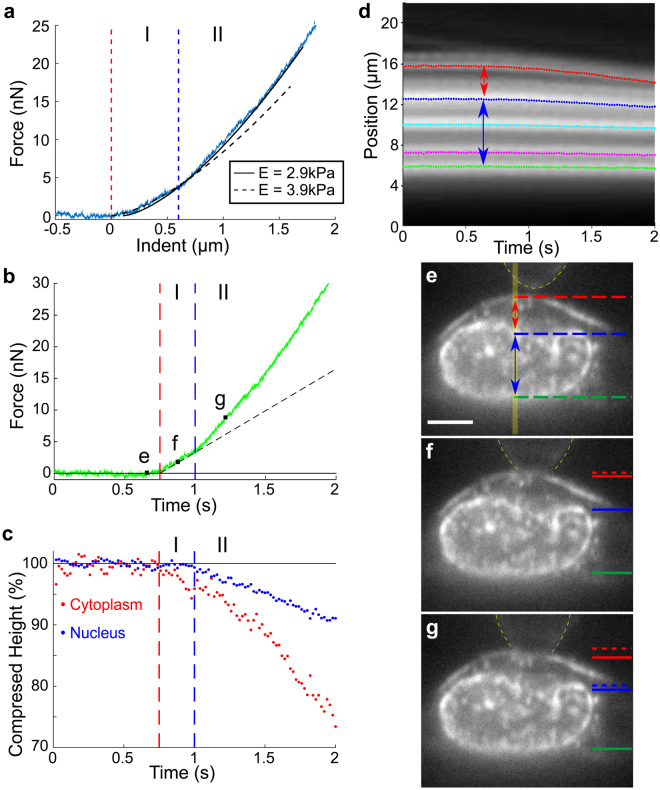
Stiffening of SKOV3 cell corresponds to onset of nuclear deformation. (a) AFM force vs. indentation data on SKOV3 cell fit to a two regime Hertz model, with the transition point (indicated by blue dashed line) determined through least squares fitting. (b) Force vs. time plot of same data as (a). Transition point from regime I to regime II as determined in (a) shows an abrupt change in slope. (c) Normalized compressed height vs. time of the cytoplasm region above the nucleus and the nucleus during indentation, as determined using kymograph data (d). The cytoplasm is defined as the region between the cell membrane (red) and the top of the nucleus (blue) indicated by red arrow in (d), and the nuclear region, indicated by blue arrow, is defined by the kymograph traces at the top (blue) and bottom (green) of the nucleus in (d). (d) Kymograph of the yellow region under AFM tip (indicated by vertical yellow bar in (e)) over the course of indentation with Gaussian tracked intensity peaks. The dotted curves correspond to the cell membrane (red), top of the nuclear region (blue), punctate labeled structures within nucleus (cyan and magenta) and the bottom of the nuclear region (green). (e–g) Sample images from a time sequence acquired simultaneously with force data, as identified on the force vs. time trace (b). Dashed lines on the left of the images indicate the initial position of the traced cytoplasm (red) and nucleus (blue) regions and solid lines indicate the current positions. Yellow dashed lines indicate outline of AFM mounted bead. Scale bar in (e) = 5 um.

