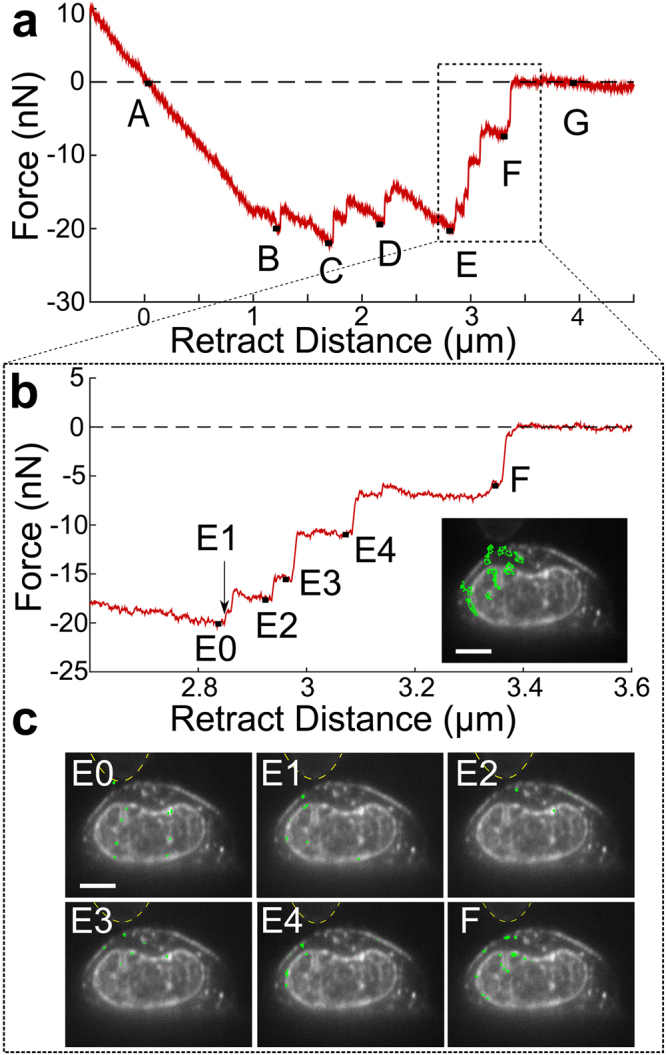
Figure 5.

Membrane and nuclear displacements observed in response to force-rupture events between the AFM-tip and cell membrane. (a) Retraction portion of force-indentation curve with important points (A-G) identified. A, the point of zero force application to the cell, B-F, force-rupture peaks, and G, after bead releases from cell. (b) A closer examination of peaks E and F with sub-peaks of the E rupture event identified. No point is shown for E1 because this is the frame immediately following Peak E0. Inset indicates regions where displacement is measured between points E and F highlighted in green. These regions were determined through difference imaging using frames taken at E and F. (c) Regions of cell displacements determined through difference imaging highlighted in green for the sub-peaks indicated in (b). Yellow dashed lines indicate outline of AFM mounted bead. Scale bars = 5 um.
