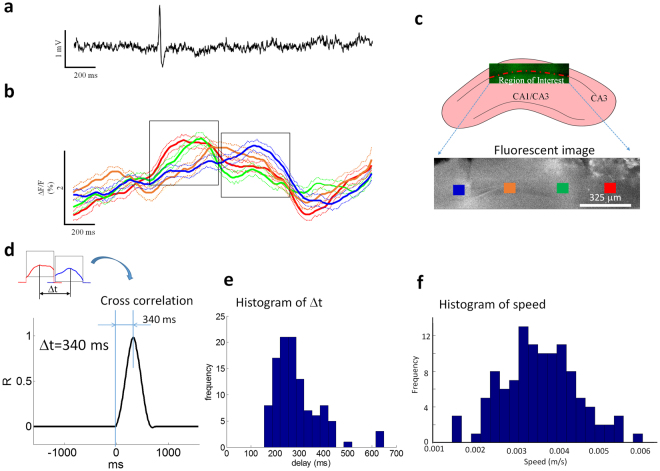
Figure 4.
Slow moving waves recorded using calcium imaging. (a) Local field potential recording from the slice in the calcium imaging experiments. (b) Optical signals of the slow moving wave from 4 different regions of interest in (c) of the hippocampal slice. Solid line: mean value. Dash line: mean +/− SD. (c) An example of imaging region in a longitudinal hippocampal slice and selected regions of interest for further analysis in the fluorescent image. (d) An example of the delay estimated by cross-correlation calculation between two optical signals (red and blue traces). (e) The histogram of estimated delay based on cross-correlation calculation from 122 events of slow moving waves. (f) The histogram of the speed of the slow moving wave detected by calcium imaging.

