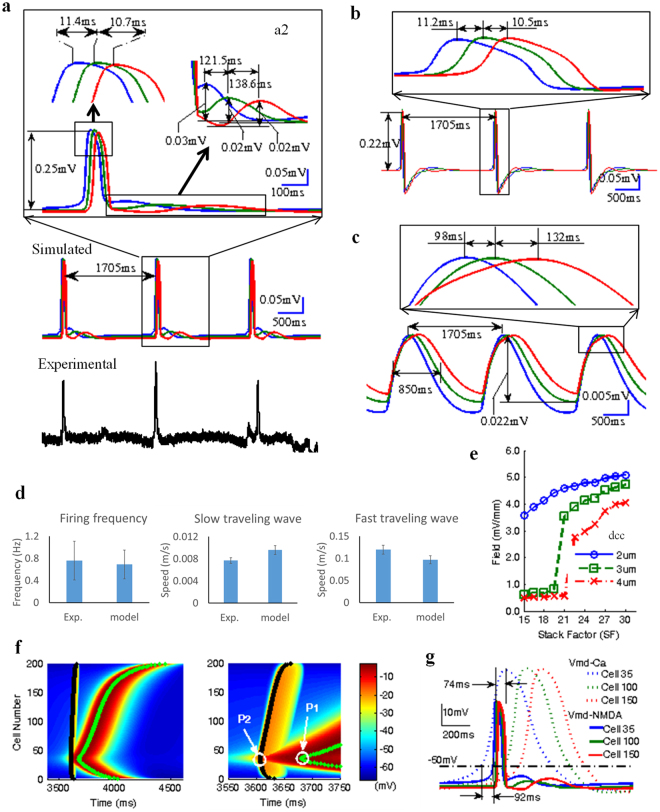
Figure 7.
Co-existence of calcium-dependent slow and NMDA-dependent fast propagations in the simulated hippocampal network. (a) Experimental and simulated local field potentials. The blue, green and red lines represent the oscillations recorded from three top virtual electrodes respectively. The local zoom of a simulated spike event can show the coexisting fast and slow oscillation propagations. (b,c) Filtered local field potentials can reveal the fast traveling spike by using 1 Hz high-pass (b) and the slow moving wave by a 1 Hz low-pass Butterworth filter (c). (d) Comparison of the, firing frequency and speeds of fast and slow moving waves, between experimental data and simulated data. (e) The curves of the simulated extracellular field amplitudes v.s. stack factor (SF) in three different cell-to-cell distances (dcc): dcc = 2, 3, 4 μm. (f) Simulated intracellular membrane potentials in the apical and basal dendritic compartments of cells in the network. The green line and black line represent the peak trajectories of calcium-dependent spikes and NMDA-dependent spikes among all cells from cell#1 to cell#200 along longitudinal direction respectively. In the time expanded window, P1 represents the first peak of the calcium-dependent spike during slow wave propagation and P2 represents the first peak of NMDA-dependent spike during fast wave propagation. (g) The transmembrane potentials of both apical and basal dendrites for three cells (35th Cell, 100th Cell, and 150th Cell along the longitudinal axis).

