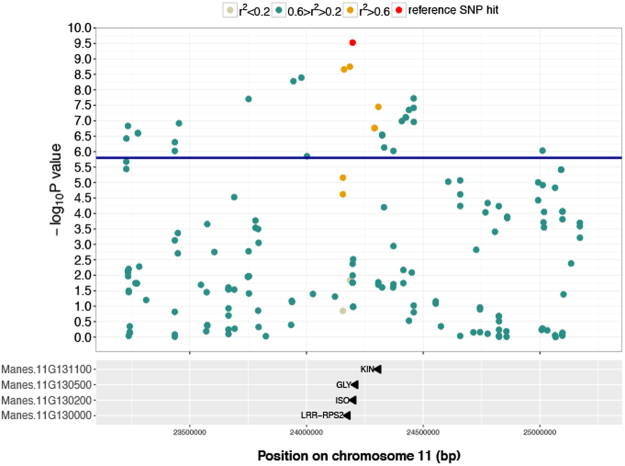
Figure 3.
Local Manhattan plot surrounding the peak on chromosome 11. The plot spans a 2 Mb region on chromosome 11. At the top, the SNP indicated in red is the SNP with the highest −log10(P-value) = 9.38 on that chromosome for CBSD symptom severity at 3 MAP. Colours indicate the Pearson’s correlation coefficient (r2) between the top significant GWAS SNP hit on this chromosome and neighboring markers in the given window. Markers with r2 > 0.2 in annotated genes are indicated in the panel below.

