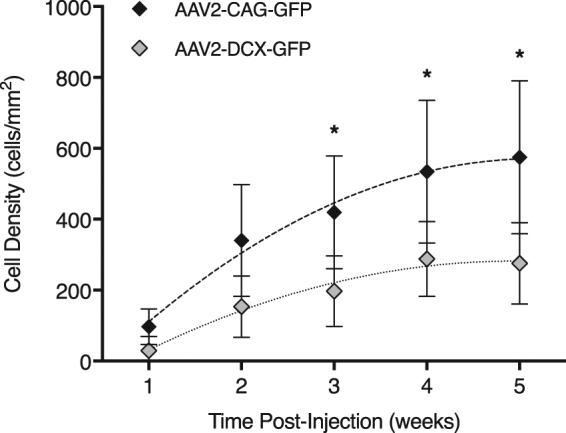
Figure 2.

Comparison of in vivo GFP expression in the ganglion cell layer between vectors after intravitreal injection. Cell densities were calculated from 30-degree field of view (approximately 1.36 mm) fluorescence confocal scanning laser ophthalmoscopy images centred at the optic nerve head for the AAV2-CAG and AAV2-DCX vectors. Trendlines show the second-order polynomial regression results calculated for each group. Error bars represent 95% confidence intervals; *p < 0.05; n = 6.
