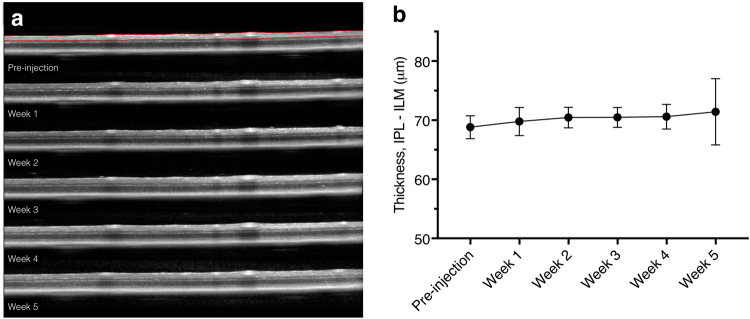
Figure 5.
Longitudinal optical coherence tomography (OCT) scans of an eye following AAV2-DCX-GFP injection. (a) Representative OCT scans in one animal obtained from the raster scanning pattern at pre-injection and at weeks 1, 2, 3, 4 and 5 after intravitreal injection. Red lines in pre-injection scan show segmentation of the inner retina (from inner plexiform layer to inner limiting membrane). (b) Mean inner retinal thickness measurement for the injected eyes measured longitudinally. No statistically significant differences were found between any of the time points. Error bars represent 95% confidence interval; n = 10.

