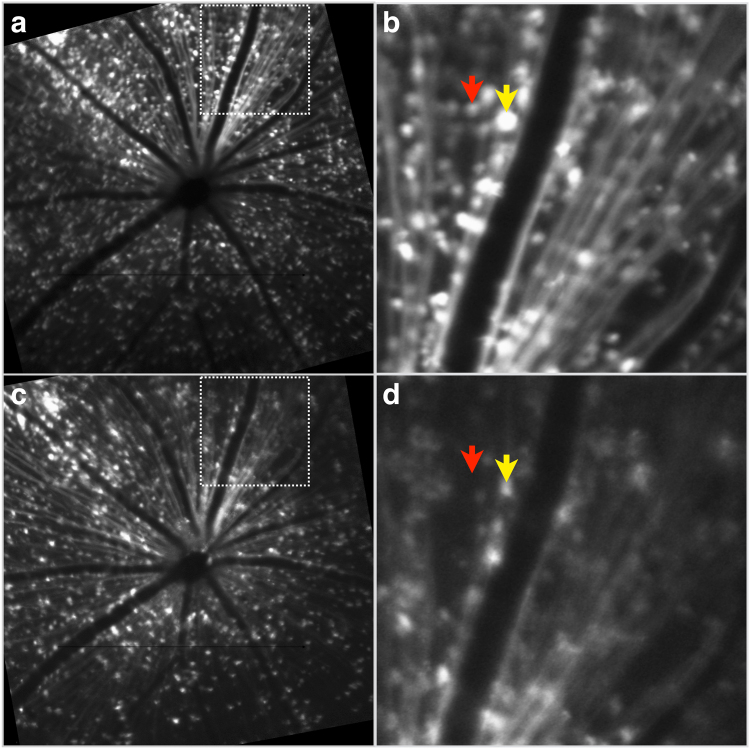
Figure 6.
GFP labelling before and after optic nerve transection. In vivo fluorescence CLSO images from the same animal and retinal region, but at different time points, following optic nerve transection. (a,b) 5 weeks post-injection of the AAV2-DCX-GFP vector to label RGCs and (c,d) 14 days post-optic nerve transection to demonstrate the effects of RGC death on GFP labelling. Panels b and d are higher magnification views of the respective regions marked by boxes in panels a and c. Arrows indicate examples of a cell that has lost all fluorescence (red) and a cell with diminished fluorescence (yellow).

