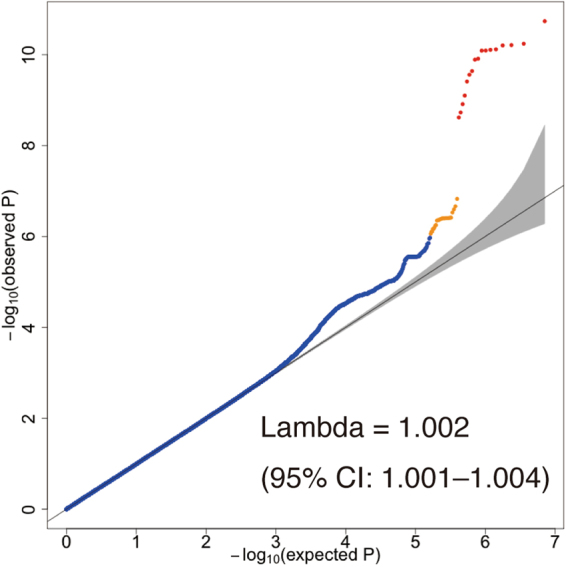
Figure 1.

Quantile-quantile plot of genome-wide association tests using discovery samples (N = 6,312). The x-axis indicates the expected −log10 P-values under the null hypothesis. The y-axis shows the observed −log10 P-values calculated by a mixed linear model association method. The black line represents y = x, which corresponds to the null hypothesis. The gray shaded area shows 95% confidence intervals of the null hypothesis. The inflation factor (lambda) is the median of the observed test statistics divided by the median of the expected test statistics. Variants with P-values indicating less than suggestive significance (P < 1 × 10⁻⁶) and genome-wide significance (P < 5 × 10⁻⁸) are shown in orange and red, respectively.
