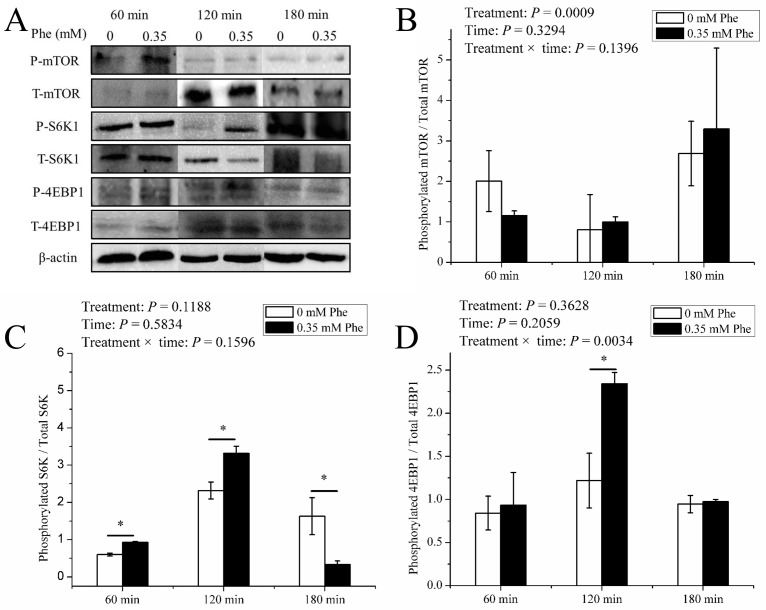
Figure 7. mTOR pathway activity of PTS.
The ratio of phosphorylation to total mTOR signal pathway factors in PTS of dairy calves cultured at 180 min in the presence of 0 or 0.35 mM L-phenylalanine. (A) The immunoblots of phosphorylation forms and total of mTOR, S6K, 4EBP1. (B–D) The ratio of the phosphorylation to total mTOR, S6K, and 4EBP1, respectively. Error bar represents SEM, n = 3. ‘—’ means the significant difference between two treatments at one time point. * means significantly different (P < 0.05).

