Figure 4.

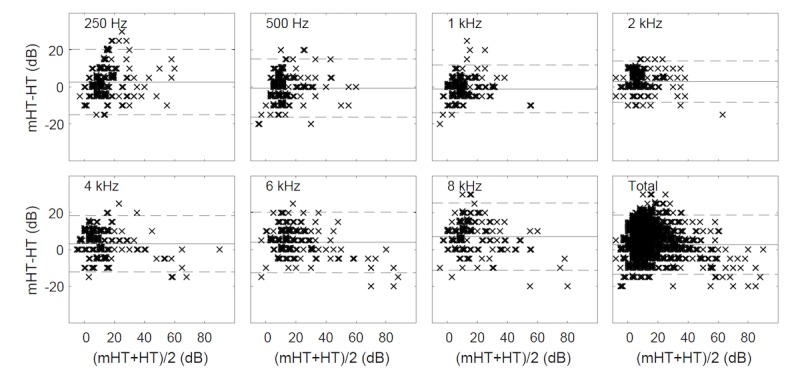
Difference plots (Bland-Altman) between the hearing threshold determined by pure-tone audiometry (HT) and on mobile devices (mHT) (continuous line indicates mean difference; dashed line indicates ±1.96 standard deviation range).

Difference plots (Bland-Altman) between the hearing threshold determined by pure-tone audiometry (HT) and on mobile devices (mHT) (continuous line indicates mean difference; dashed line indicates ±1.96 standard deviation range).