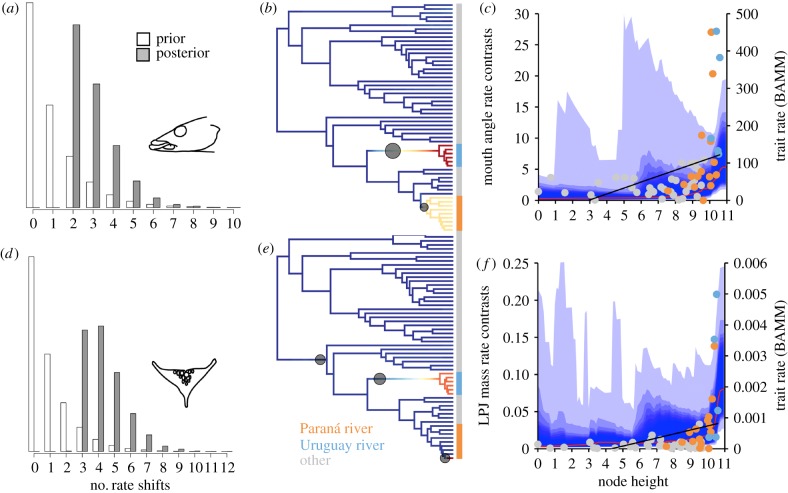
Figure 3.
Rates of morphological evolution across the Crenicichla phylogeny. Prior and posterior distribution of rate shifts (a,d), most probable shift configuration from BAMM (b,e), rate through time (c,f), and node-height test (c,f) for mouth angle (a–c) and size-relative lower pharyngeal jaw (LPJ) mass (d–f). Less probable shift configurations are shown in the electronic supplementary material. Mean rate through time (red lines) is from BAMM analysis and the best fit lines (black lines) are fitted to the node-height tests.

