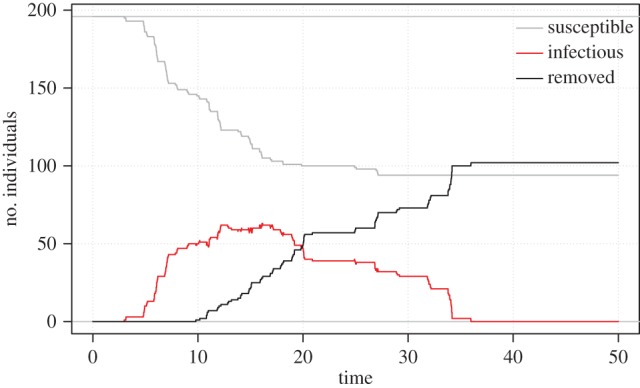
Figure 1.

Susceptible infected removed plot. Outbreak trajectories of susceptible colonies (grey line), infected colonies (red line) and removed colonies (black line). Removed refers to colonies that became diseased during the monitoring period and then the disease lesion stopped progressing.
