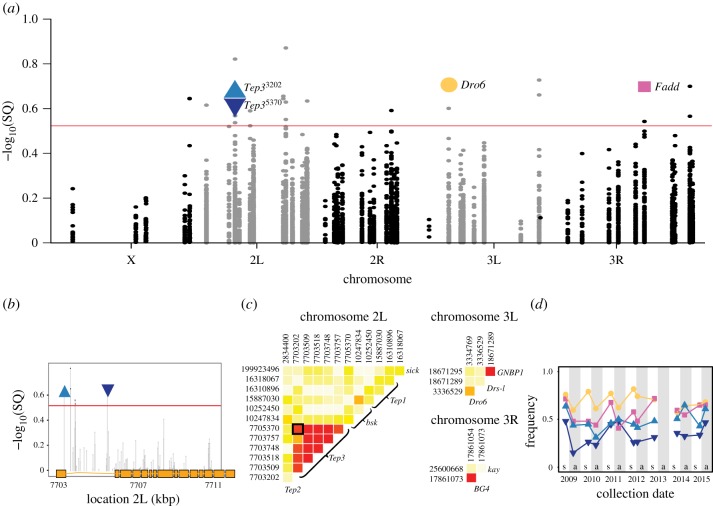
Figure 2.
Seasonal changes in immune genes in natural populations. (a) Manhattan plot of SNPs in immune genes that change in frequency across seasonal time [29]. The red line indicates the seasonal q-value cutoff > 0.3 [29]. The SNPs on which functional analyses were performed are highlighted: Fadd, Dro6, Tep33202 and Tep35370. (b) Manhattan plot of SNPs in immune genes within Tep3 with genic structure along the x axis. Exons indicated in orange boxes. (c) Heat map showing linkage disequilibrium among SNPs in immune genes across each chromosome using DGRP. (d) Cycling of seasonal allele frequencies of candidate immune SNPs in Pennsylvania in the spring (s) and the autumn (a) from 2009 to 2015. (Online version in colour.)

