
Figure 1.
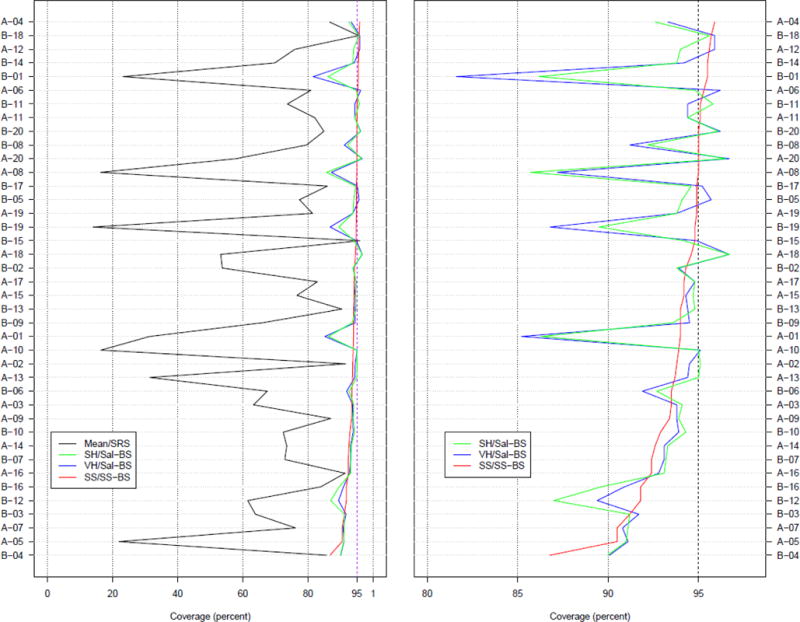
95% confidence interval (CI) coverage percentages for 40 sets of RDS simulations (sampling without replacement; studentized bootstrap CI method). The horizontal axis is the nominal 95% CI coverage percentage, and the vertical axis is the 40 simulation sets ordered from top to bottom by the SS coverage percentage (the red line). The left panel’s horizontal axis ranges from 0 to 100%; the right panel’s horizontal axis ranges from 80% to 100% for detail. The coverage percentages for the sample mean do not appear in the right panel.