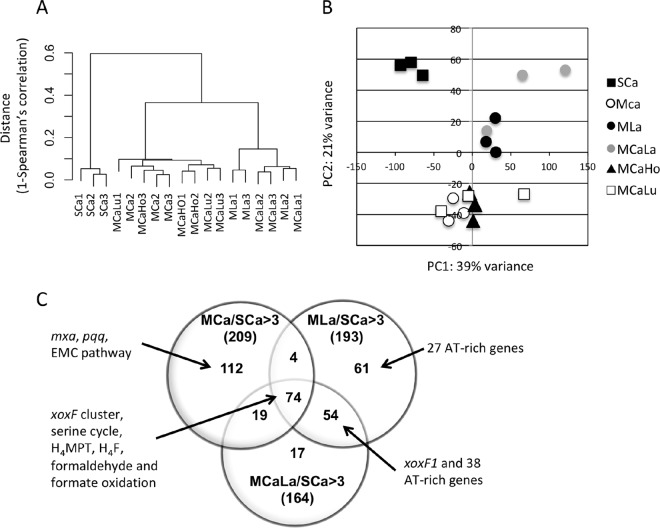
FIG 2 .
(A) Dendrogram based on the log2-transformed expression data of all CDSs, according to Ward’s clustering method as a distance measure with Spearman’s 1 correlation. (B) Principal-component analysis based on the log2-transformed expression data of all CDSs. (C) Venn diagram of the number of differentially expressed CDSs. Upregulated CDS numbers under the MCa, MLa, and MCaLa conditions compared to the SCa condition are counted (fold change, >3; P < 0.05 under any of the conditions).

