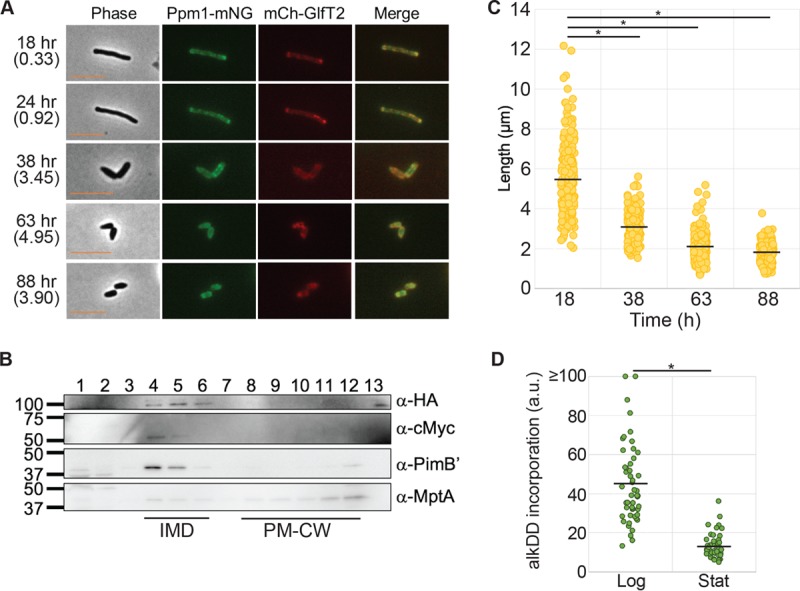
FIG 1 .

The IMD redistributes during stationary phase. (A) Fluorescence live imaging of the dual IMD marker strain expressing HA-mCherry-GlfT2 (mCh-GlfT2) and Ppm1-mNeonGreen-cMyc (Ppm1-mNG). Cells show reorganization of the IMD during stationary phase. Cell density (the OD600) is shown in parentheses to indicate the growth stage. Scale bar, 5 µm. (B) Western blotting detection of IMD markers after sucrose gradient sedimentation of stationary-phase cell lysate (48 h), demonstrating the biochemical isolation of the IMD. IMD markers were HA-mCherry-GlfT2 (anti-HA, 100 kDa), Ppm1-mNeonGreen-cMyc (anti-c-Myc, 59 kDa), and PimB′ (anti-PimB′, 42 kDa). The PM-CW marker was MptA (anti-MptA, 54 kDa). Note that the apparent molecular mass of MptA based on the SDS-PAGE was ~43 kDa (28). (C) Lengths of cells from logarithmic-phase growth (18 h) to stationary-phase growth (38, 63, and 88 h), showing the production of short cells. The black lines indicate averages of 202 cells. (D) Quantification of alkDADA incorporation normalized to cell sizes of stationary-phase cells (OD > 3.0), showing decreased de novo PG synthesis. The black lines indicate averages of 50 cells. *, P < 0.001.
