FIG 5 .
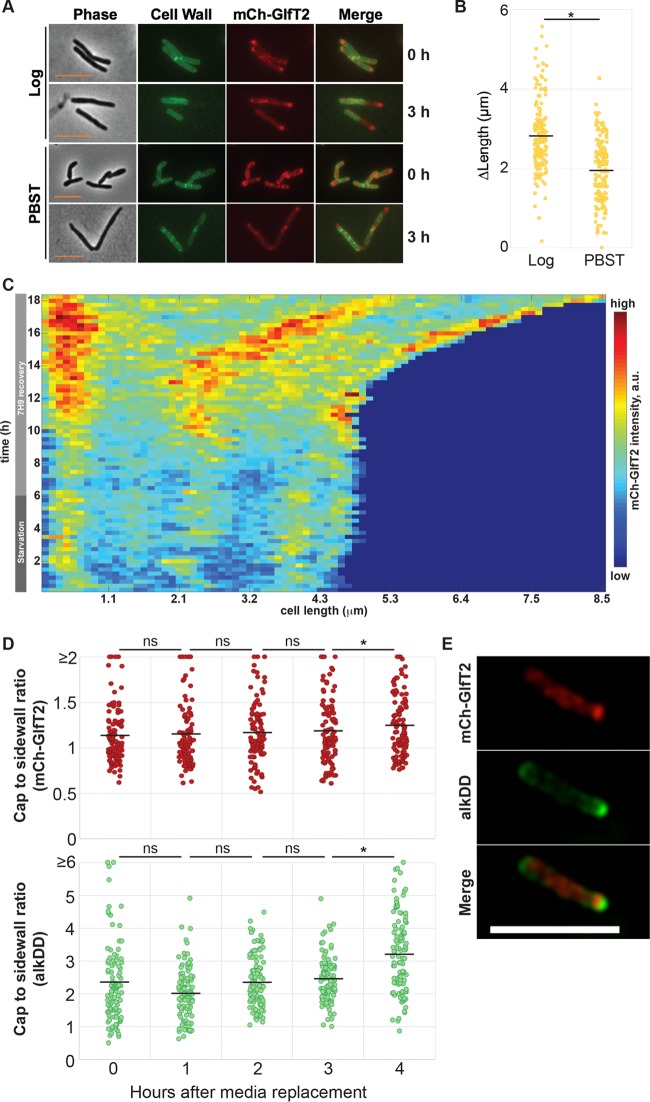
Polar enrichment of the IMD is restored after starvation and correlates with the initiation of PG synthesis and cell elongation. (A) Fluorescence live imaging of logarithmically growing (log) and starved cells (PBST, 30 h) immediately after cell surface staining with amine-reactive Alexa Fluor 488 fluorescent dye (0 h) or after being grown in fresh medium for 3 h. The single IMD marker strain expressing HA-mCherry-GlfT2 alone was used. Polar regions unstained by the amine-reactive dye indicate the areas of cell envelope growth during the 3-h growth period. Scale bar, 5 µm. (B) Cell envelope elongation after a 3-h recovery period, demonstrating that greater elongation is observed in actively growing cells (log) than in the cells recovering from PBST starvation. The black lines indicate the averages of 204 cells. (C) Kymograph from time-lapse imaging of the dual IMD marker strain expressing HA-mCherry-GlfT2 and Ppm1-mNeonGreen-cMyc and starved in PBST for 6 h and recovered in fresh Middlebrook 7H9 medium, showing recovery of the polar IMD after ~4 h of medium replacement and subsequent cell growth. A representative cell is shown, and others are shown in Fig. S6. The darkest blue (lower right) demarks areas of the graph beyond the length of the cell at that time point. (D) Polar enrichment (cap/sidewall ratio) of the IMD (mCherry-GlfT2) and PG synthesis (alkDADA) increases at the 4-h recovery time point after 6 h of starvation in PBST. The single IMD marker strain expressing HA-mCherry-GlfT2 was used. Representative images are also shown in Fig. S6. The black lines indicate the averages of 201 cells. (E) SIM images of the single IMD marker strain recovering from 6 h of PBST starvation, demonstrating the polar PG synthesis (alkDADA) and the IMD enrichment (mCh-GlfT2) slightly subpolar and adjacent to the PG synthesis after 4 h of recovery. *, P < 0.001; ns, not significant. Scale bar, 5 µm.

