
FIG 1 .
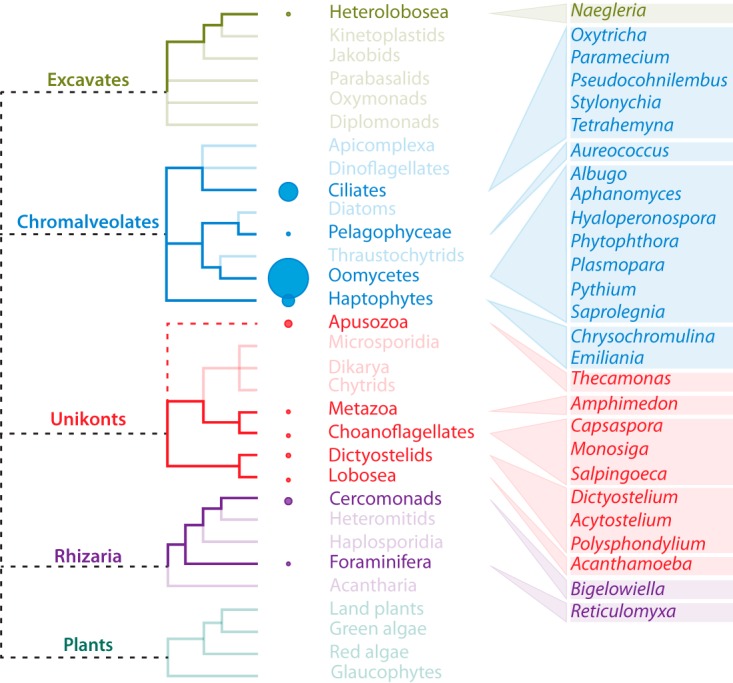
Consensus cladogram of selected eukaryotes, with lineages and genera with species having one or more GPCR-PIPKs highlighted in bold. The size of the circles is proportional to the average number of GPCR-PIPKs per taxon. The tree is based on phylogenies described by Keeling et al. and Koonin (67, 68), and the placement of the Apusozoa is based on data reported by Paps et al. (69). Dashed polytomies indicate unresolved relationships.