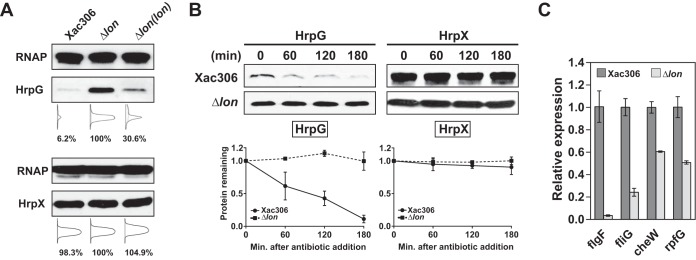
FIG 3 .
Lon degrades HrpG in rich medium. (A) HrpG and HrpX expression levels in wild-type strain 306, the Δlon mutant, and the Δlon mutant with chromosomal complementation were detected by immunoblotting. Densitometry plots were generated on the basis of the pixels of each band with ImageJ. The relative intensity of protein bands was calculated in percentages. RNAP, RNA polymerase. (B) In vivo degradation assays showing the stability of HrpG and HrpX. Epitope-tagged HrpG and HrpX were constitutively expressed under the control of Ptrp in the wild type and the Δlon mutant. Protein levels were monitored by immunoblotting (top). Band intensities were quantified (bottom), and error bars represent the standard deviations (n = 3). Statistical data of HrpG-6His are also shown in Fig. 4A. (C) Relative expression of genes specifically regulated by HrpG. Cells were incubated in rich medium overnight, and RNA samples were isolated. The expression of flgF, fliG, cheW, and rpfG was monitored by qRT-PCR. The mean values ± the standard deviations (n = 3) are plotted.

