FIG 2 .
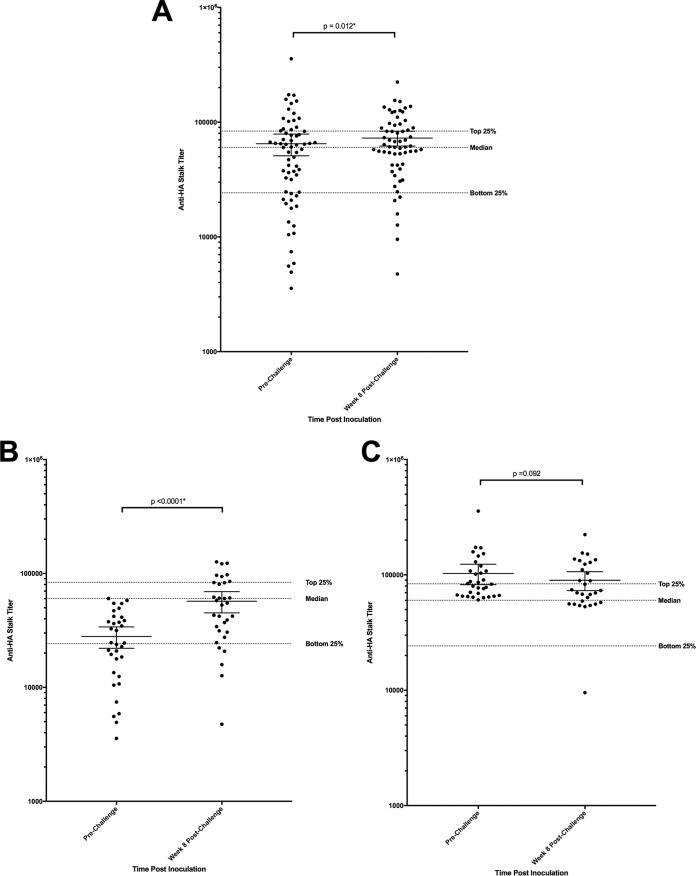
Anti-HA stalk antibody titers pre- and postchallenge. (A) Mean titer with 95% confidence intervals for all participants both prechallenge and 8 weeks postchallenge with 2009 H1N1pdm. This increase was significant (P = 0.012*). Each circle represents the value for an individual. (B) Mean titer with 95% confidence intervals for all participants who demonstrated a prechallenge titer less than the median prechallenge titer of 60,221. They had a larger increase postchallenge (P < 0.0001*). (C) Mean titer with 95% confidence intervals for all participants that demonstrated a prechallenge titer above the median titer (>60,221). These individuals demonstrated no significant increase in the overall titer (P = 0.092). The dotted lines represent the bottom 25%, median, and top 25% of all prechallenge anti-HA stalk antibody titers. Statistically significant P values are indicated with an asterisk.

