
Figure 3.
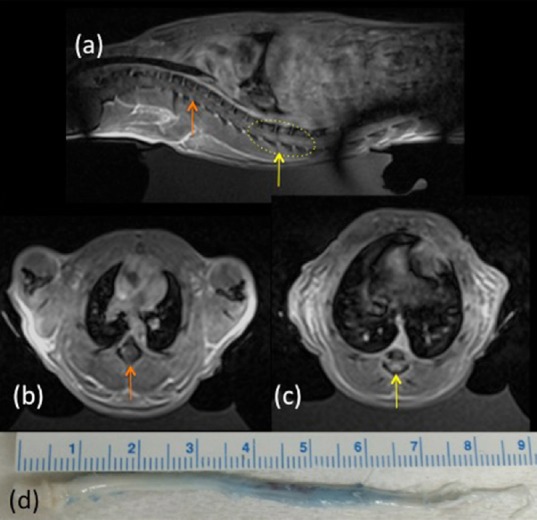
Example of a thoracic blood-spinal cord barrier opening.
(a) CE-T1W MR images showing spinal cord enhancement in sagittal (left side rostral and right side caudal to sonication region). MRgFUS sonications were applied in the yellow dashed region. (b, c) Axial views of (b) non-enhancement (orange arrow) and (c) enhancement (yellow arrow) regions of the spinal cord. (d) Excised spinal cord showing extensive Evans blue dye penetration through 3 cm of the cord. Cord orientation is the same as seen in (a). Note the banding artifact in (a) was due to a B1 transmit shim decoupling failure.