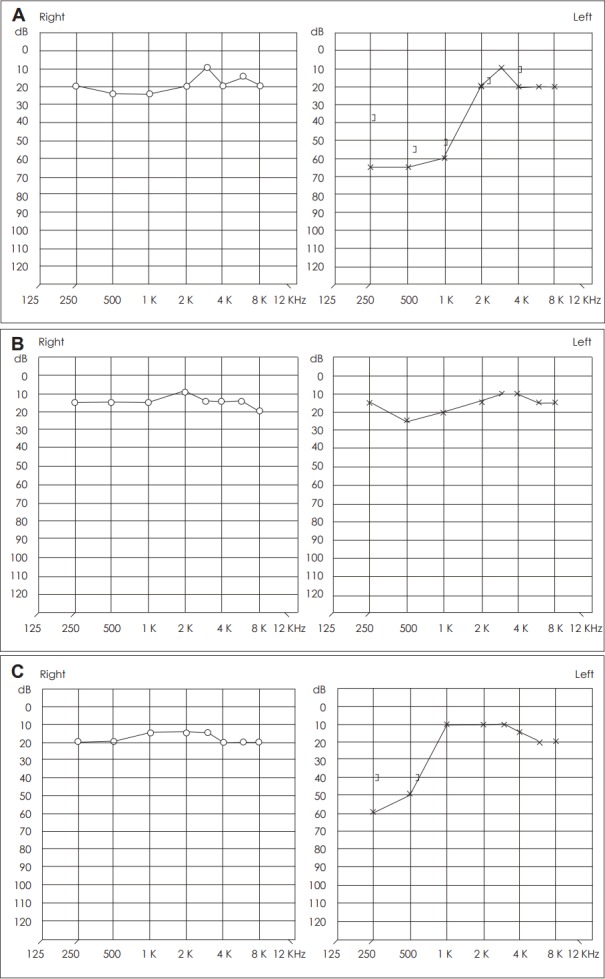
Fig. 1.

Images of the pure-tone audiogram. A: The initial examination shows low frequency hearing loss in the left ear. B: Five days after the initial examination, the audiogram shows improvement of left-side hearing to normal. C: Twelve days after the initial examination, the audiogram shows low frequency hearing loss in the left ear. dB: decibel, Hz: hertz.
