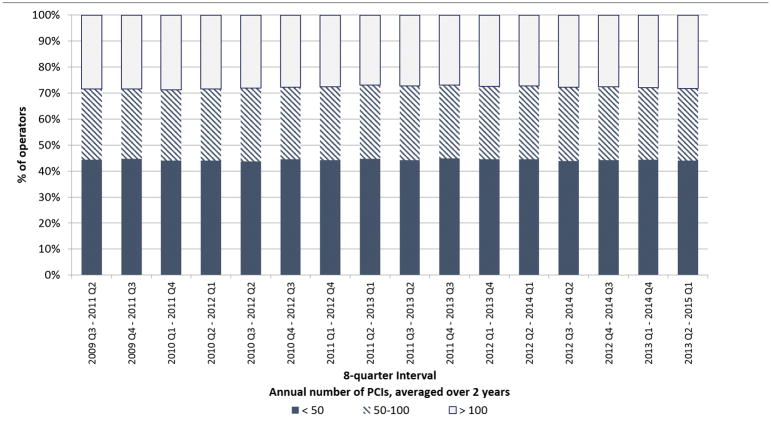
Figure 2. Changes in annual operator volume over the study period.
Stacked bar graphs depict the percentage of operators performing < 50, 50–100, and > 100 PCIs annually averaged over the 16 overlapping eight-quarter (two-years) intervals that comprised the study period. Between 43.7 and 44.8% of operators performed < 50 PCIs/year in each interval.

