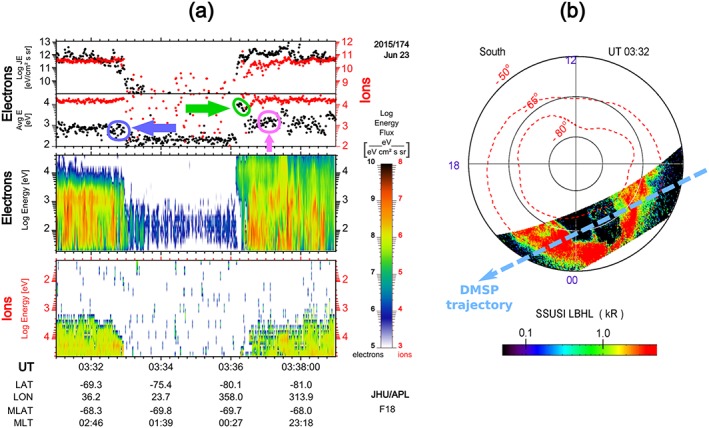
Figure 2.

DMSP F18 observations during a storm time substorm on 23 June 2015. (a) The auroral particle observations from SSJ 5 instrument. (top to bottom) Differential energy flux of ions in red dots and electrons in black dots, average energy of ions and electrons, the energy spectrogram of electrons, and energy spectrogram of ions. Note that in the ion spectrogram the y direction is reversed so that ion energy is increasing down. The green arrow/oval on average energy plot (Figure 2a, second row) emphasizes the highly increased average electron energies on the plasma sheet entry at 03:36 UT, compared to the exit from PS at 03:30 UT marked by the blue arrow/oval. Also, the pink arrow/oval marks the lower energy equatorward portion of electrons. (b, right) The LBHL auroral image scanned across the DMSP F18 trajectory. The trajectory mapped to 120 km is shown approximately by the dashed blue line.
