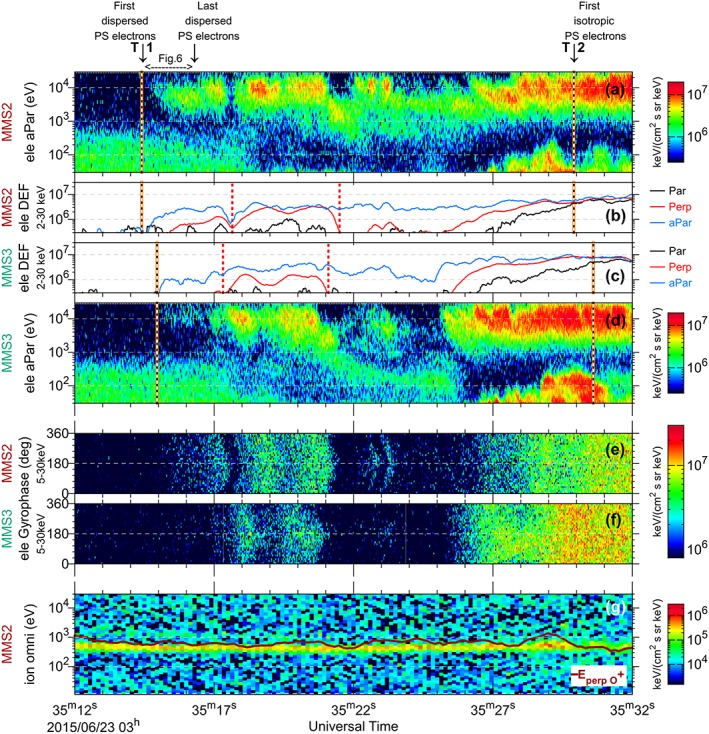
Figure 7.

Comparison of electron beam observation by two MMS spacecraft. (a and d) Energy spectrograms for antiparallel moving electrons from MMS2 and MMS3 (energy level above the photoelectrons at 30 eV). (b and c) The differential energy flux for parallel, perpendicular, and antiparallel population with energies between 2 and 30 keV. (e and f) The gyrophase of the perpendicular high‐energy electrons (5–30 keV) for MMS2 and MMS3. (g) The MMS2 omnidirectional energy spectrogram of ions, with overplotted red line indicating convecting O+ population (see section 3.4 for details).
