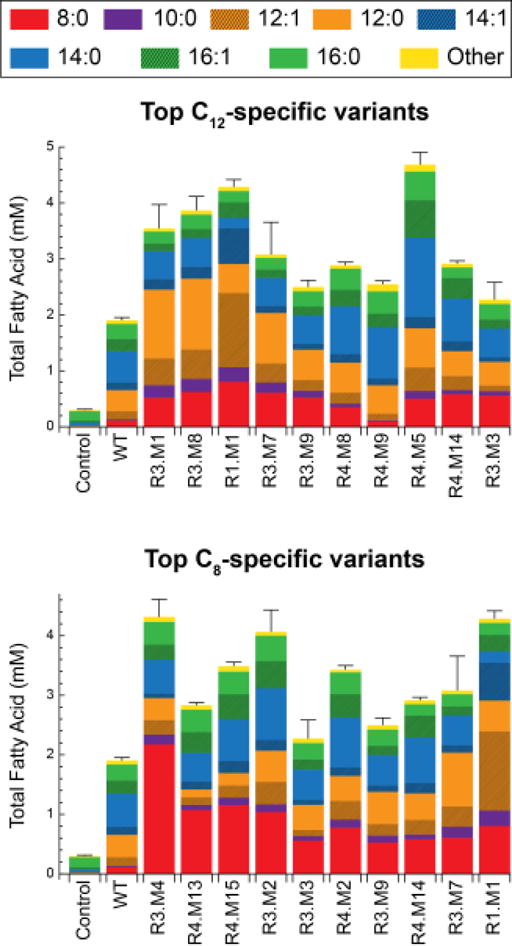
Figure 3. Fatty acid production profiles for the most C12-specific and C8-specific computationally designed variants.

FFA titers are shown as bars, where error bars indicate total FFA standard deviation. Profiles of uninduced cells (Control) and wild-type ‘TesA (WT) are provided for reference. All profiles are listed in Table S1.
