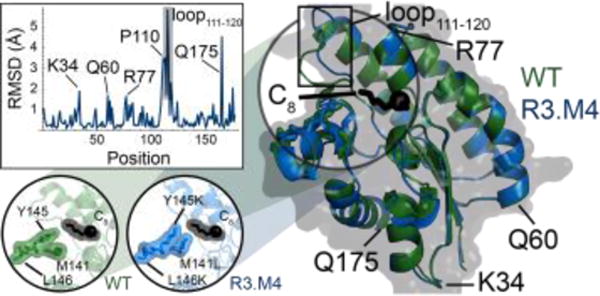
Figure 5. Comparison of WT and R3.M4 crystal structures.

Both WT (green) and R3.M4 (blue, pH 5.0) are shown as cartoons to the right of the figure bound to octanoic acid (C8). The carbonyl oxygen of each FFA structure is shown as a sphere. Regions with relatively large changes (RMSD ≥ 1.5 Å) are annotated. Quantification of the structural differences is shown with the inset plot of RMSD versus sequence position. The structural differences between the residues at positions 141, 145, and 146 (the mutated positions in R3.M4) are depicted in the bottom left inset. Here, each of the three residues, as well as octanoic acid, is represented as sticks with a transparent surface.
