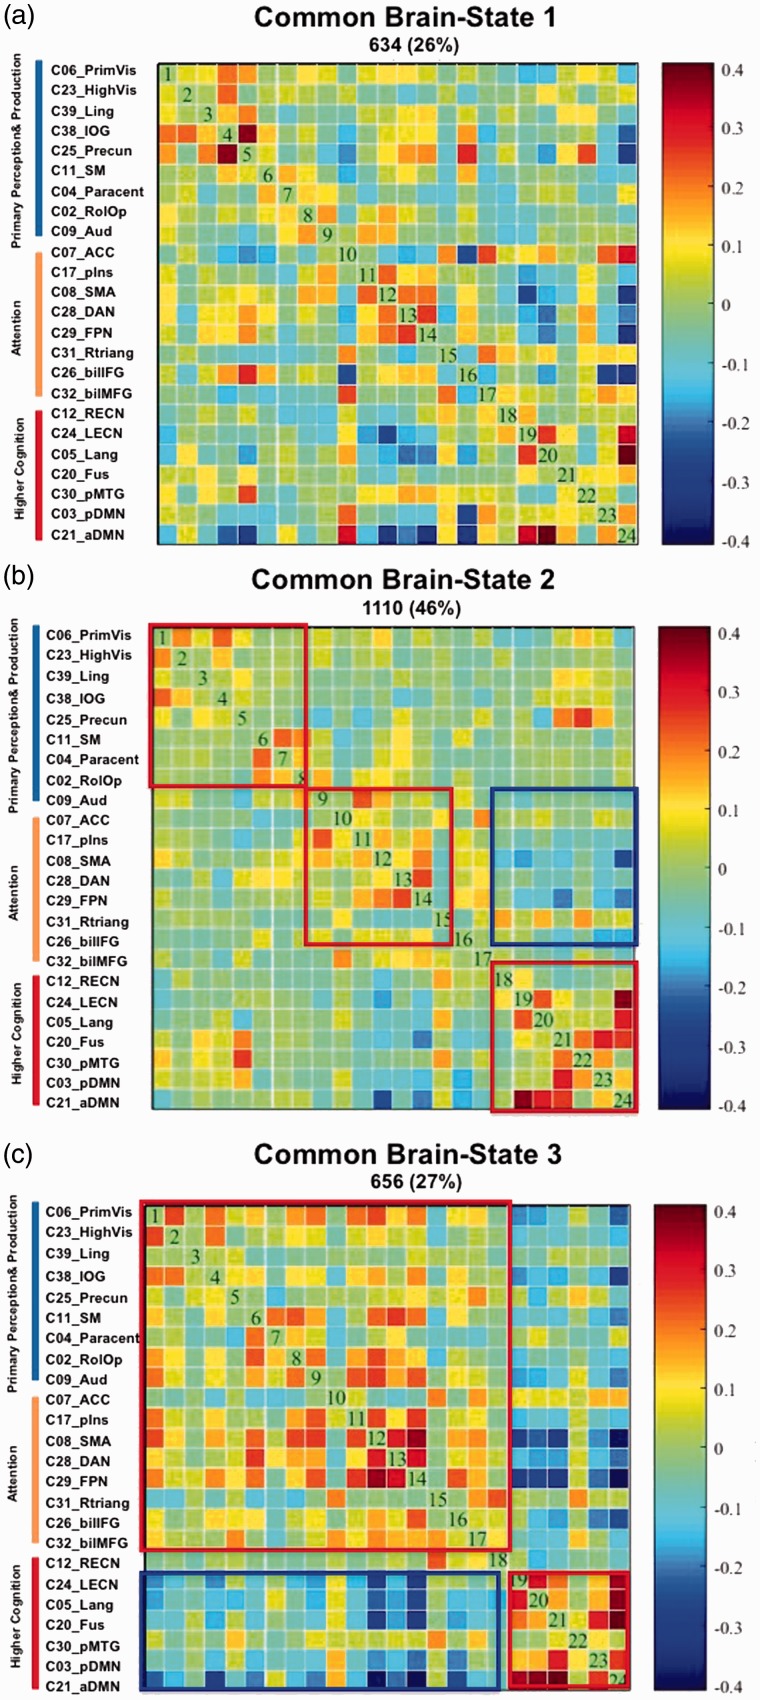
Figure 4.
The three brain states. (a–c) The different network configurations of the three brain states that were extracted using k-mean clustering of the 2,400 windows (200 windows of 30 TRs = 60s length for each of the 12 participants) that were analyzed in the context of the SWA. The cluster matrixes show the 24 ICs arranged in three groups; group membership is indicated by colored bars on the left side (blue = ICs representing primary perception [auditory and visual] and production [motion] networks, orange = ICs representing attention networks, and red representing higher order cognitive network). Red rectangles highlight positive correlations or coupling between networks/ICs, and blue rectangles highlight negative correlations or decoupling between the networks/ICs. Further, positive correlations between networks/ICs and subsystems are coded in warm/red colors, and negative correlations between networks/ICs and subsystems in cold/blue colors.
SWA = sliding windows analysis; IC = independent components; IOG = inferior occipital gyrus; ACC = anterior cingulate; SMA = supplementary motor area; DAN = dorsal attention network; FPN = frontoparietal network; LECN = left executive-control network; RECN = right executive-control network; aDMN = anterior default mode network; pDMN = posterior default mode network; MTG = middle temporal gyrus.

