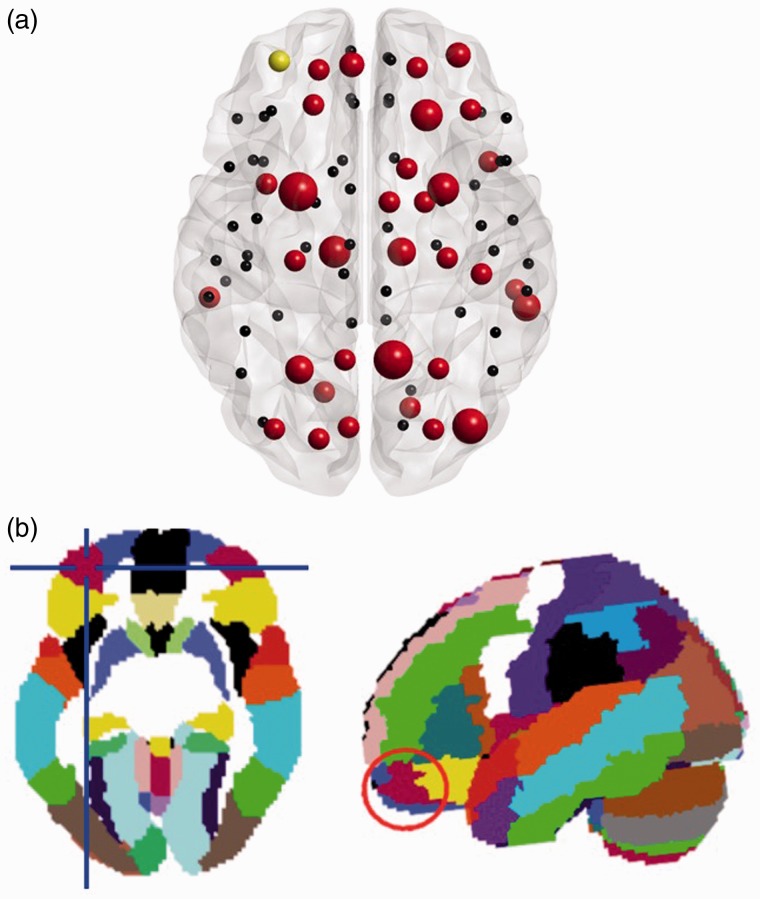
Figure 7.
Illustration of the rich club members in the healthy controls. (a) Localization of the analyzed rich club nodes in the healthy controls. The red color indicates a rich club node, the size of the red nodes relates to their degree. Yellow marks the node in the most rostral part of left middle frontal gyrus whose value in nodal strength value was significantly associated (Spearman’s r = −.86) with the subjects’ dwell time in Brain State 3. (b) Localization (regions highlighted by red circle) of the node in the AAL template.

