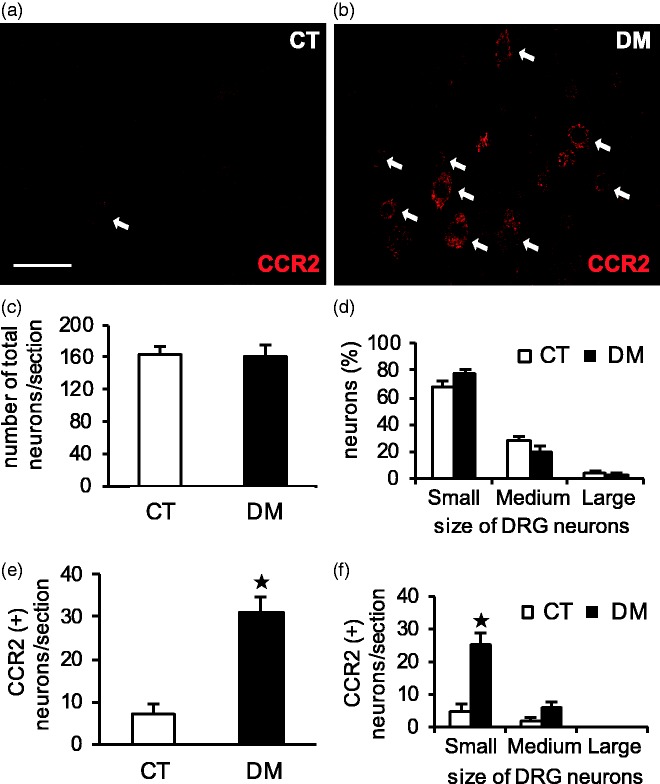
Figure 5.
Cellular localization of CCR2-IR in T10 DRG at two weeks after STZ administration. Representative images of immunostaining with anti-CCR2 antibody in control (CT) (a) and diabetic (DM) (b) rats. Arrows represent CCR2-positive cells. Scale bar: 50 µm. Number of total and CCR2-IR neurons per section (c, e) and their size distribution (d, f) were determined in both the CT and DM groups. Data are shown as mean ± SEM, *p < 0.001 CT versus DM, n = 4 rats per group. CCR2 was exclusively expressed in small- and medium-sized DRG neurons in both the CT and DM rats (a, b, f). CCR2-IR neurons were significantly more numerous in the DM group than in the CT (a, b, e) despite no significant change between them in total DRG neurons per section (c). The number of CCR2-IR cells was relatively greater in small DRG neurons of DM rats according to the size distribution of the DRG neurons (d, f).

