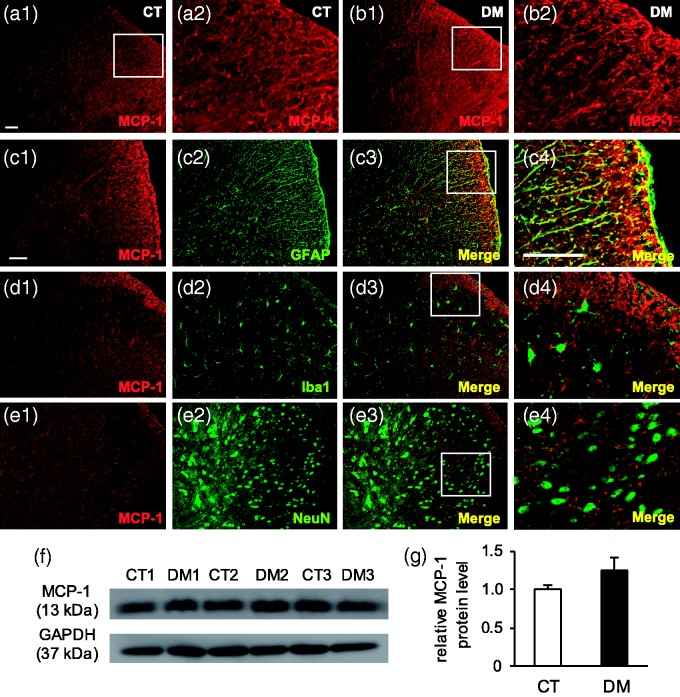
Figure 8.
Immunolocalization of MCP-1 and its protein level in T10 spinal cord at two weeks after STZ administration. Representative images of immunostaining with anti-MCP-1 antibody in control (CT) (a) and diabetic (DM) (b) rats. (a2) and (b2) are higher magnification images of white-boxed regions in (a1) and (b1), respectively. Scale bar: 50 µm. MCP-1 was expressed in the whole spinal cord (n = 4 rats per group). Double-labeling IHC showed MCP-1 to be co-localized with astrocyte marker (GFAP) (c), but not with microglial (Iba1) (d) and neuronal (NeuN) (e) markers. Scale bar: 50 µm. (f) Representative Western blot analyses using anti-MCP-1 and GAPDH antibodies are shown. GAPDH was used as a loading control. CT 1–3: CT rats; DM 1–3: DM rats. (g) Semi-quantitative densitometric data for MCP-1-IR are shown. Data are shown as mean ± SEM, n = 3 rats per group. The MCP-1 protein level was higher in the DM group than in the CT group, but the data were not significant.

