
Fig. 3.
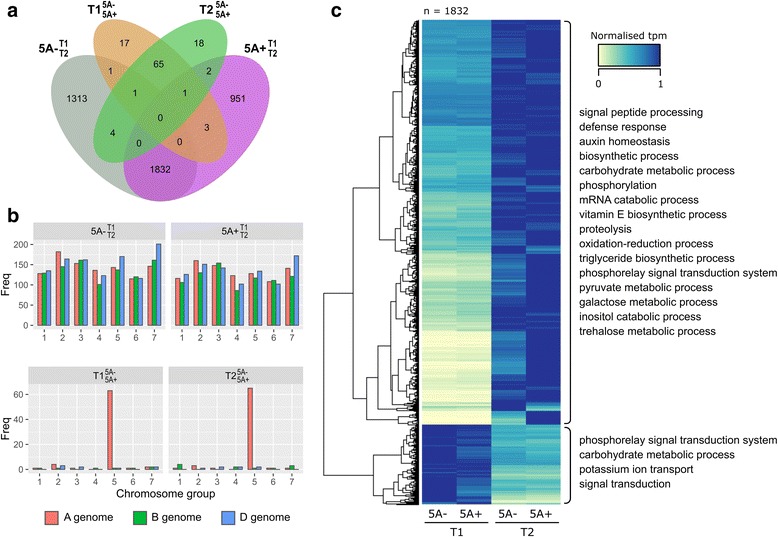
Overview of differentially expressed transcripts. a Venn diagram of differentially expressed (DE) transcripts (q < 0.05) identified in 4 pairwise comparisons: (orange), (green), (grey) and (purple). b Number of DE transcripts located on each chromosome for all comparisons. The and DE transcripts (top graphs) are evenly distributed across all 21 chromosomes whereas and DE transcripts (bottom graphs) are concentrated on chromosome 5A. c Heatmap of normalised tpm (transcripts per million) of common DE transcripts in and (n = 1832). Hierarchical clustering separated these into transcripts that were upregulated (n = 1532) and downregulated (n = 300) across time. Significantly enriched GO terms (biological function only) for each group are shown on the right of the heatmap