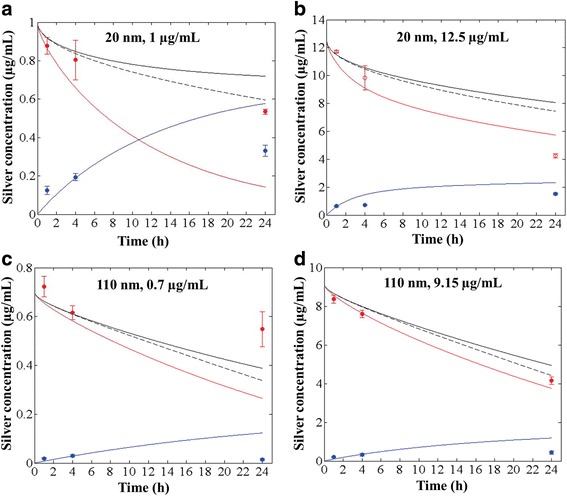
Fig. 6.

ISD3 predictions for the concentration of silver nanoparticles and ions in the liquid media. Comparison between ISD3 results (solid lines) and experiments (symbols) for total silver concentration (black), silver nanoparticle concentration (red) and silver ion concentration (blue) in the liquid column as a function of time. Results are shown for four systems with initial particle concentration and diameter: 1 μg/mL and 20 nm (a); 12.5 μg/mL and 20 nm (b); 0.7 μg/mL and 110 nm (c); and, 9.15 μg/mL and 110 nm (d). The black dashed line corresponds to the total particle concentration of silver, predicted in the absence of dissolution
