
Figure 2.
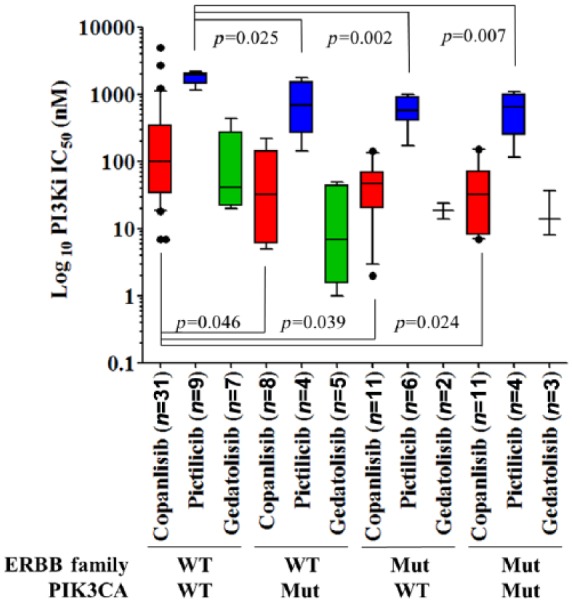
Comparison of IC50 values for copanlisib in green (n = 61),84 pictilisib in blue (n = 23)85 and gedatolisib in red (n = 17)86 when assessed relative to the ERBB family or PIK3CA mutational status of each cell line. Displayed p values were calculated using Student’s t test and were deemed significant if p < 0.05. Mut, mutation; WT, wild type.