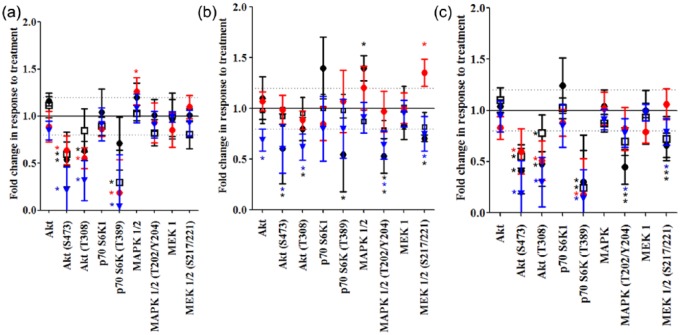
Figure 4.
The impact of (a) copanlisib, (b) afatinib or (c) copanlisib and afatinib on expression and phosphorylation of proteins in the PI3K/AKT or MAPK/ERK signaling pathways relative to vehicle treated controls as measured by reverse phase protein array analysis. ‘•’ represents the ERBB/PIK3CA wild type (WT) cell line (KLE), ‘ ’ the PIK3CA mutation (Mut)/ERBB family WT cell line (HT29), ‘□’ the ERBB family Mut/PIK3CA WT cell line (C2BBE1) and ‘
 ’ the ERBB family/PIK3CA Mut cell line (H1975). Error bars are representative of standard deviations across triplicate independent experiments. Fold changes of ⩾1.2 and with a p value of <0.05 as calculated by Student’s t test are classified as significant by the use of an asterisk of a similar color to the relevant cell line.

