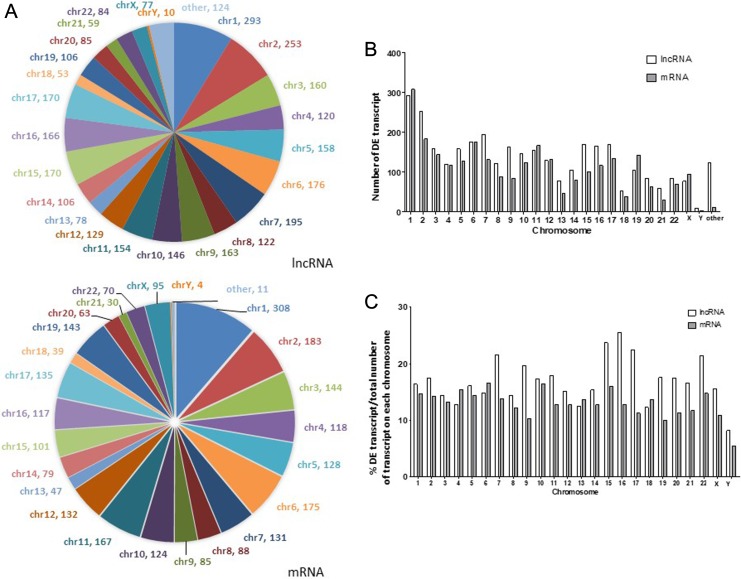
Figure 2.
Chromosome distribution of DE lncRNA and mRNA in PDAC versus noncancerous tissue. A, Distribution of DE lncRNA and mRNA on each chromosome. B, Number of DE lncRNA or mRNA on each chromosome. C, Number of DE transcripts (lncRNA or mRNA) normalized to total number of annotated transcript (lncRNA or mRNA) on each chromosome. DE indicates differentially expressed; lncRNA, long noncoding RNA; mRNA, messenger RNA; PDAC, pancreatic ductal adenocarcinoma.

