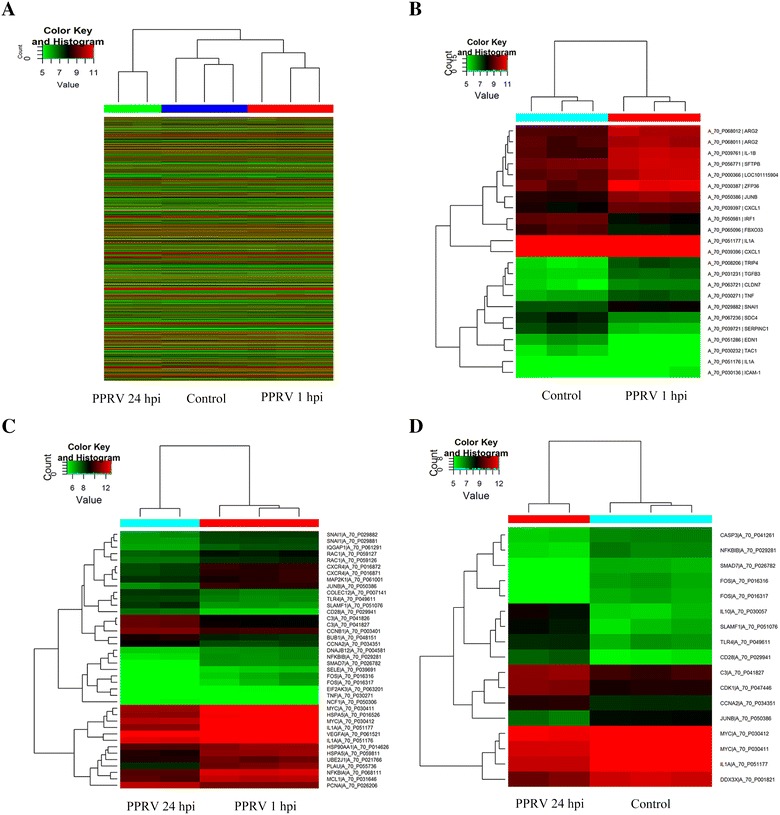
Figure 3.

Heatmaps of differentially expressed genes. A Unsupervised hierarchical clustering based on the set of all differentially expressed genes in response to early PPRV infection. Expression levels in the heatmaps are color coded from green (low) to red (high). B Expression profile in EECs at 1 hpi compared with the control samples. Heatmap representations of the 19 upregulated genes and four downregulated genes after PPRV adsorption and internalization are shown. C Expression profile in EECs at 24 hpi compared to those at 1 hpi. Heatmap of 32 differentially expressed genes, including 10 upregulated genes and 22 downregulated genes expressed during viral replication. D Expression profile in EECs at 24 hpi compared with the control samples. Heatmap of 17 differentially expressed genes, including 7 upregulated genes and 10 downregulated genes expressed during viral replication.
