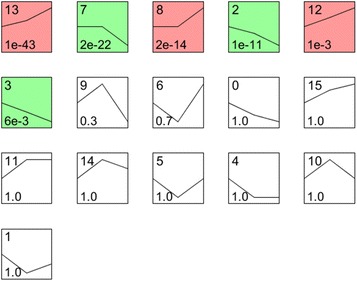
Figure 4.

Expression patterns of all differentially expressed genes analyzed as model profiles. The expression patterns of the genes were analyzed and 16 model profiles were used to summarize the data. Each box represents a model expression profile. The upper number in the profile box is the model profile number and the lower one is the P value. Six expression patterns of genes showed significant P values (< 0.05) (colored boxes).
