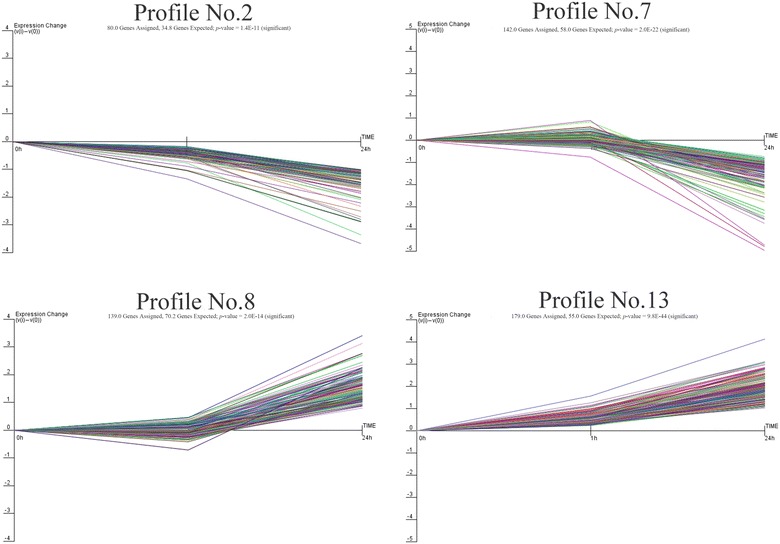
Figure 5.

Gene expression of profile Nos 2, 7, 8, and 13 during significant PPRV infection. Profiles No. 2 and No. 7 contained 222 genes with downregulated expression after infection. Profiles No. 8 and No. 13 contained 318 genes with upregulated expression, consistent with the replication of the virus after infection. The horizontal axis represents the time points after infection, and the vertical axis shows the expression level of the gene after log-normalized transformation.
