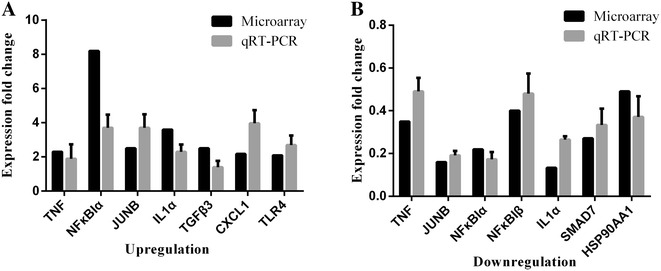
Figure 8.

Comparison of DNA microarray and real-time PCR data. DNA microarray results and qRT–PCR quantification of the changes in expression levels of 10 selected cellular genes in goat endometrial epithelial cells at 1 h after exposure to PPRV. Data are expressed as fold changes in cellular gene expression. A Upregulated genes identified in the DNA microarray and qRT–PCR experiments after PPRV exposure for 1 and 24 h. B Downregulated genes identified in the DNA microarray and qRT–PCR experiments after exposure to PPRV for 24 h. Data are expressed as mean ± SD (n = 3).
