Fig. 4.

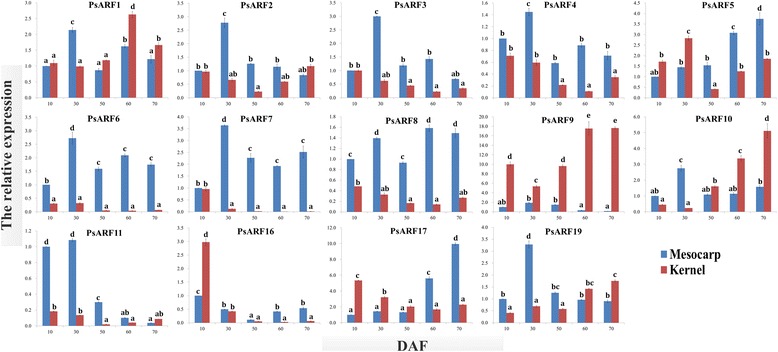
The qRT-PCR analysis of PsARF genes in developing SAM and SAK. The relative expression levels were calculated as 2-△△Ct, and the expression data of SAM at 10 DAF served as control. Data are means ± SE of three separate measurements

The qRT-PCR analysis of PsARF genes in developing SAM and SAK. The relative expression levels were calculated as 2-△△Ct, and the expression data of SAM at 10 DAF served as control. Data are means ± SE of three separate measurements