


Fig. 3.
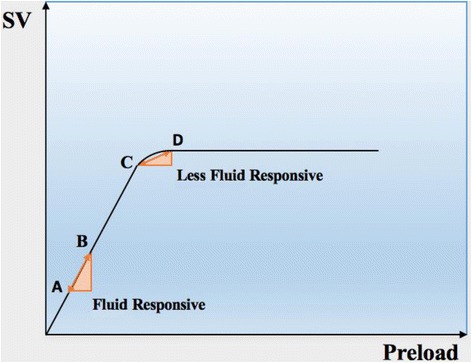
Frank–Starling curve of preload against left ventricular stroke volume (SV), demonstrating the change in SV induced by cyclic positive-pressure ventilation (A↔B and C↔D). The starting position on the curve indicates the level of variation possible in the SV after an increase in the preload. Once the patient ascends the curve (A → C), fluid responsiveness decreases in response to mechanical ventilation (C↔D)