
Fig. 1.
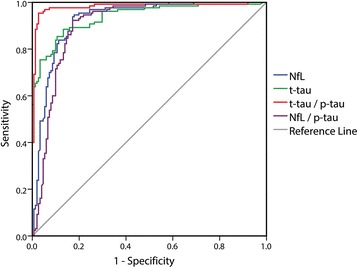
ROC analysis for cerebrospinal fluid (CSF) biomarkers in the comparison between prion disease and other neurodegenerative dementias (NDs). ROC curves illustrate sensitivity and specificity of various CSF biomarker combinations in the differential diagnosis between prion disease and other NDs. AUC values are reported. The corresponding AUC values are also listed in Table 5. NfL Neurofilament light chain protein, p-tau Phosphorylated tau protein, t-tau Total tau protein