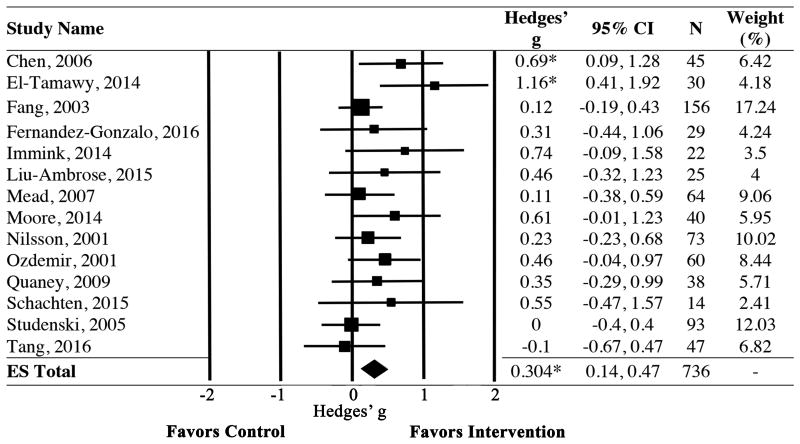
Figure 2.
Forest plot showing individual study and pooled effects of PA training on cognitive function. Positive values of Hedges' g reflect improvements in cognitive performance among those in the PA group relative to controls. Random effects model used. ES=Effect Size; CI=Confidence Interval. *p<0.05

