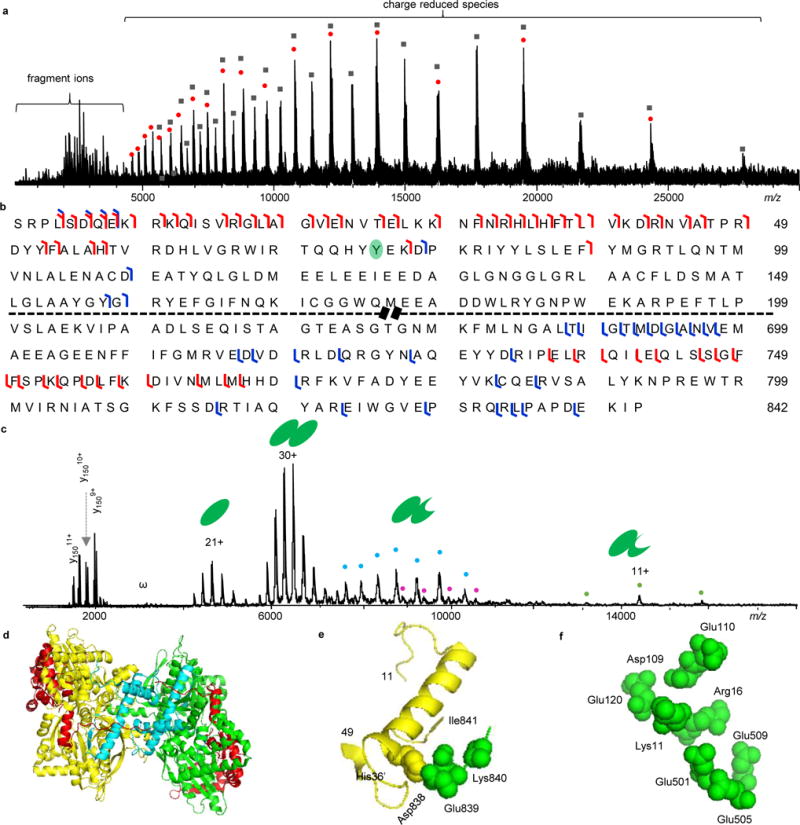
Figure 3.

Native top-down MS analysis of GP. a) ISD-CAD-ECD spectrum of GP. The red dots represent charge-reduced monomers and the black-filled squared are charge-reduced dimers. b) Fragmentation map of GP with ISD-CAD-ECD fragmentation sites colored in red and IRMPD sites in blue. c) IRMPD spectrum of GP. “ω” represents harmonic peaks and the cyan, purple, and orange dots represent noncovalently bound fragment peaks. d) GP structure with ISD-CAD-ECD fragmentation sites in red and IRMPD sites in cyan. e) The C-terminal residues 838–841 form salt bridges with His36′ from the other subunit. f) The N-terminal basic residues (K9RKQISVR16) interact intra-molecularly with a pocket of acidic residues Asp109, Glu110, Glu120, Glu501, Glu505, and Glu509. The first 10 amino acid residues were not presented in the PDB (8GPB) structure.
