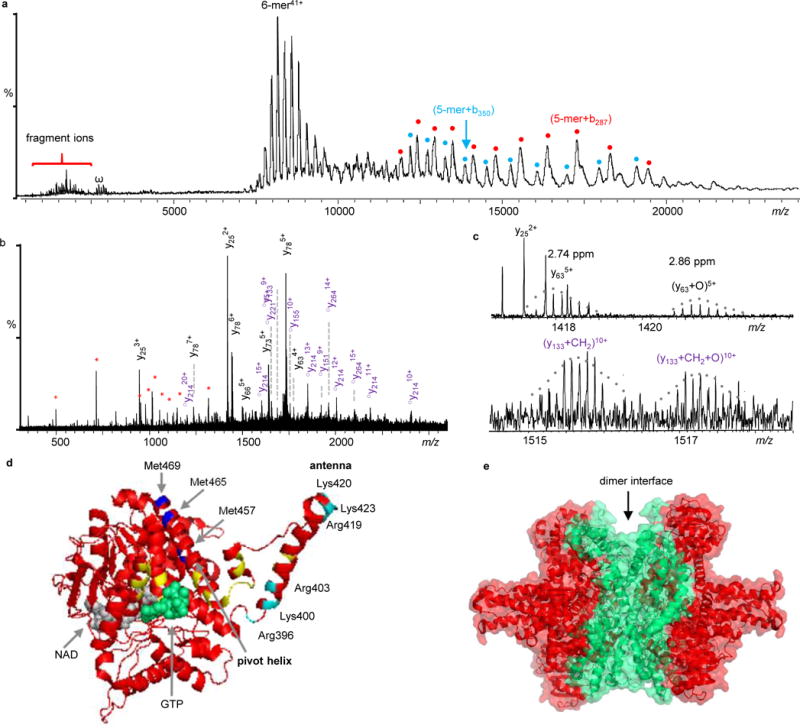
Figure 5.

Native top-down MS analysis of GDH. a) IRMPD mass spectrum of GDH. Fragment ions labeled in cyan and red dots are 5-mer+b287 and 5-mer+b350, respectively. They are complementary ions of y214 and y151, respectively. b) Expanded spectrum of the low-m/z region of Fig. 5a. The y-ions in black are unmodified, ○ym represent y-ions with methylation (○ym= ym+CH2), and internal fragments are in red *. Detailed peak lists are available in Supplementary Table 3. c) Expanded spectra to show GDH proteoforms with different PTMs. d) Locations of observed PTMs. The potential oxidation sites (Met457, Met465, or Met469) are colored in blue and methylation site (Lys400, Lys420, Lys423, Arg396, Arg403, or Arg419) are in cyan. GTP is in green and NAD is in grey. Mutation sites reported in human GDH are labeled in yellow. e) Structure of GDH with the sequence coverage regions by IRMPD colored in red.
